(Photo credit: 5’s Zoltar team)
Aug 13, 2025
NATURAL GAS
ERCOT POWER MARKET
WEATHER
Spot natural gas at the NYMEX Henry Hub is at its lowest price this year, down 29% from January (Figure 1).
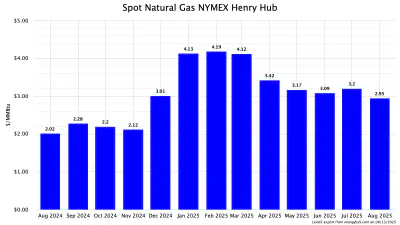
Figure 1. Spot natural gas at NYMEX Henry Hub, monthly averages
(Credit: Level5)
Henry Hub Futures have sold off since July, especially in the closer years (Figure 2). For those who want fixed price gas, this is a buying opportunity.
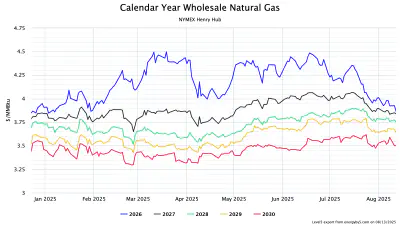
Figure 2. Natural gas futures at NYMEX Henry Hub, annual strips from 2026 through 2030
(Credit: Level5)
North America natural gas storage is trending above the 5-year average and below 2024 storage values (Figure 3). Keep in mind 2024 values were relative outliers. The common factor between 2024 and 2025 natural gas storage trends is the relatively cooler summer.
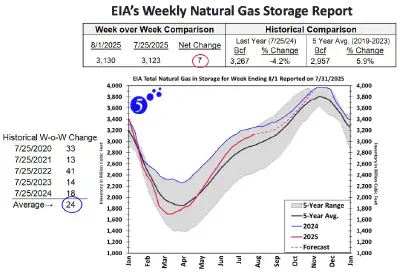
Figure 3. EIA’s weekly natural gas storage report for week ending 2025-08-01
(Credit: 5’s Zoltar team using data published by the U.S. Energy Information Administration)
Natural gas rig counts have increased by 27%, year-on-year. This will increase natural gas supply and be a bearish force on market prices.
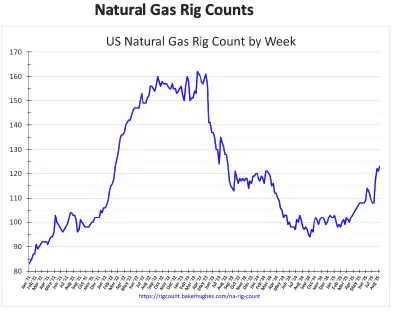
Figure 4. North America natural gas rig counts, 2021-2025
(Credit: 5’s Zoltar team using data published by Baker Hughes)
For those with curtailable loads, the best value is still in the spot market. Average monthly prices this summer have ranged from $29.47/MWh (June) to $54.37 (August) (Figure 5). The primary driver in August’s higher prices is the hotter weather.
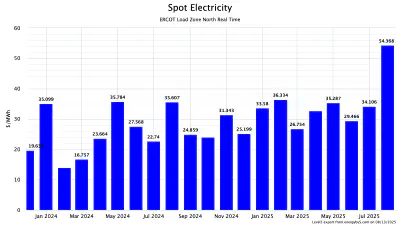
Figure 5. ERCOT spot electricity at North load zone, monthly averages from January 2024 through August 2025
(Credit: Level5)
ERCOT annual futures have been relatively flat since April with a modest selloff over the last couple of weeks (Figure 6).
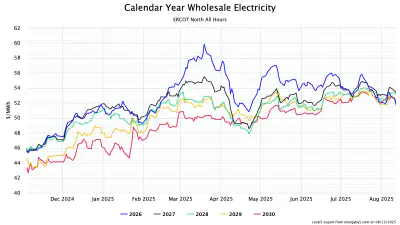
Figure 6. ERCOT annual futures at North load zone, from November 11, 2023 through August 12, 2025
(Credit: Level5)
For August and September, the highest coincident peak (4CP) risk is typically near the beginning of the month. The highest 4CP risk days for August 13-18 are August 13, August 14, and August 18 (Figure 7).
If you want to receive 4CP alerts, please contact me.
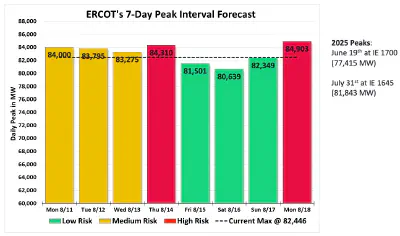
Figure 7. ERCOT 7-day peak interval forecast
(Credit: 5’s Zoltar team)
It’s hot across most of the U.S. and it’s likely to stay that way over the next week (Figure 8). The Midwest and Northeast should get some relief late next week (Figure 9), however the seasonal forecast predicts a relatively warm late summer and fall (Figure 10).
Hotter weather in the late summer and early fall are bullish forces in the ERCOT market.
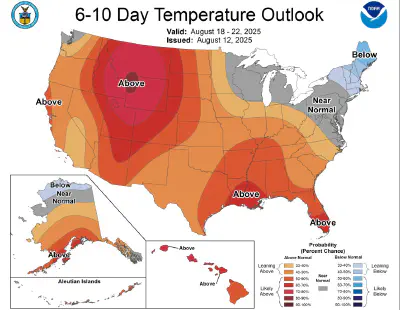
Figure 8. NOAA 6-10 day temperature outlook, issued August 12, 2025
(Credit: NOAA)
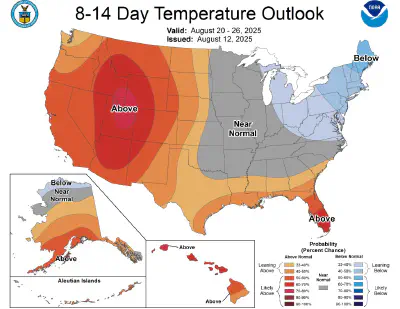
Figure 9. NOAA 8-14 day temperature outlook, issued August 12, 2025
(Credit: NOAA)
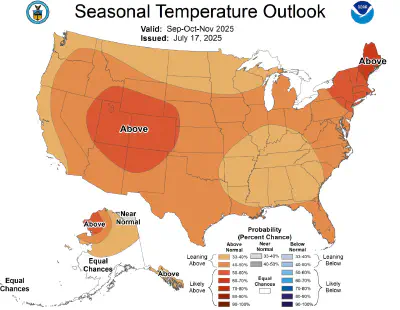
Figure 10. NOAA seasonal temperature outlook, issued August 12, 2025
(Credit: NOAA)
The Digital Energy team specializes in site development and energy portfolio management for large power loads. For a private consultation, please send us a message.